对鸢尾花数据集和月亮数据集,分别采用线性LDA、k
一、简述算法线性LDA、k-means和SVM算法
算法基本思想LDALDA 是一种可作为特征抽取的技术,其目标是向最大化类间差异,最小化类内差异的方向投影,以利于分类等任务即将不同类的样本有效的分开。LDA 可以提高数据分析过程中的计算效率,对于未能正则化的模型,可以降低维度灾难带来的过拟合k-means在K-means算法中K是事先给定的,这个K值的选定是非常难以估计的;在K-means算法中,首先需要根据初始聚类中心来确定一个初始划分,然后对初始划分进行优化;从K-means算法框架可以看出,该算法需要不断地进行样本分类调整,不断地计算调整后的新的聚类中心,因此当数据量非常大时,算法的时间开销是非常大的。SVMSVM (支持向量机)是一种算法,它以以下方法做工,它是一种种非线性映射额,把原训练数据映射到较高的维上,在新的维上,它搜索最佳分离超平面。二、线性判别分析LDA
1.鸢尾花数据集
import numpy as np import matplotlib.pyplot as plt from sklearn.datasets.samples_generator import make_classification class LDA(): def Train(self, X, y): """X为训练数据集,y为训练label""" X1 = np.array([X[i] for i in range(len(X)) if y[i] == 0]) X2 = np.array([X[i] for i in range(len(X)) if y[i] == 1]) # 求中心点 mju1 = np.mean(X1, axis=0) # mju1是ndrray类型 mju2 = np.mean(X2, axis=0) # dot(a, b, out=None) 计算矩阵乘法 cov1 = np.dot((X1 - mju1).T, (X1 - mju1)) cov2 = np.dot((X2 - mju2).T, (X2 - mju2)) Sw = cov1 + cov2 # 计算w w = np.dot(np.mat(Sw).I, (mju1 - mju2).reshape((len(mju1), 1))) # 记录训练结果 self.mju1 = mju1 # 第1类的分类中心 self.cov1 = cov1 self.mju2 = mju2 # 第2类的分类中心 self.cov2 = cov2 self.Sw = Sw # 类内散度矩阵 self.w = w # 判别权重矩阵 def Test(self, X, y): """X为测试数据集,y为测试label""" # 分类结果 y_new = np.dot((X), self.w) # 计算fisher线性判别式 nums = len(y) c1 = np.dot((self.mju1 - self.mju2).reshape(1, (len(self.mju1))), np.mat(self.Sw).I) c2 = np.dot(c1, (self.mju1 + self.mju2).reshape((len(self.mju1), 1))) c = 1/2 * c2 # 2个分类的中心 h = y_new - c # 判别 y_hat = [] for i in range(nums): if h[i] >= 0: y_hat.append(0) else: y_hat.append(1) # 计算分类精度 count = 0 for i in range(nums): if y_hat[i] == y[i]: count += 1 precise = count / nums # 显示信息 print("测试样本数量:", nums) print("预测正确样本的数量:", count) print("测试准确度:", precise) return precise if '__main__' == __name__: # 产生分类数据 n_samples = 500 X, y = make_classification(n_samples=n_samples, n_features=2, n_redundant=0, n_classes=2,n_informative=1, n_clusters_per_class=1, class_sep=0.5, random_state=10) # LDA线性判别分析(二分类) lda = LDA() # 60% 用作训练,40%用作测试 Xtrain = X[:299, :] Ytrain = y[:299] Xtest = X[300:, :] Ytest = y[300:] lda.Train(Xtrain, Ytrain) precise = lda.Test(Xtest, Ytest) # 原始数据 plt.scatter(X[:, 0], X[:, 1], marker='o', c=y) plt.xlabel("x1") plt.ylabel("x2") plt.title("Test precise:" + str(precise)) plt.show()
1234567891011121314151617181920212223242526272829303132333435363738394041424344454647484950515253545556575859606162636465666768697071727374
2.月亮数据集
import numpy as np import matplotlib.pyplot as plt from sklearn.datasets import make_moons class LDA(): def Train(self, X, y): """X为训练数据集,y为训练label""" X1 = np.array([X[i] for i in range(len(X)) if y[i] == 0]) X2 = np.array([X[i] for i in range(len(X)) if y[i] == 1]) # 求中心点 mju1 = np.mean(X1, axis=0) # mju1是ndrray类型 mju2 = np.mean(X2, axis=0) # dot(a, b, out=None) 计算矩阵乘法 cov1 = np.dot((X1 - mju1).T, (X1 - mju1)) cov2 = np.dot((X2 - mju2).T, (X2 - mju2)) Sw = cov1 + cov2 # 计算w w = np.dot(np.mat(Sw).I, (mju1 - mju2).reshape((len(mju1), 1))) # 记录训练结果 self.mju1 = mju1 # 第1类的分类中心 self.cov1 = cov1 self.mju2 = mju2 # 第1类的分类中心 self.cov2 = cov2 self.Sw = Sw # 类内散度矩阵 self.w = w # 判别权重矩阵 def Test(self, X, y): """X为测试数据集,y为测试label""" # 分类结果 y_new = np.dot((X), self.w) # 计算fisher线性判别式 nums = len(y) c1 = np.dot((self.mju1 - self.mju2).reshape(1, (len(self.mju1))), np.mat(self.Sw).I) c2 = np.dot(c1, (self.mju1 + self.mju2).reshape((len(self.mju1), 1))) c = 1/2 * c2 # 2个分类的中心 h = y_new - c # 判别 y_hat = [] for i in range(nums): if h[i] >= 0: y_hat.append(0) else: y_hat.append(1) # 计算分类精度 count = 0 for i in range(nums): if y_hat[i] == y[i]: count += 1 precise = count / (nums+0.000001) # 显示信息 print("测试样本数量:", nums) print("预测正确样本的数量:", count) print("测试准确度:", precise) return precise if '__main__' == __name__: # 产生分类数据 X, y = make_moons(n_samples=100, noise=0.15, random_state=42) # LDA线性判别分析(二分类) lda = LDA() # 60% 用作训练,40%用作测试 Xtrain = X[:60, :] Ytrain = y[:60] Xtest = X[40:, :] Ytest = y[40:] lda.Train(Xtrain, Ytrain) precise = lda.Test(Xtest, Ytest) # 原始数据 plt.scatter(X[:, 0], X[:, 1], marker='o', c=y) plt.xlabel("x1") plt.ylabel("x2") plt.title("Test precise:" + str(precise)) plt.show()
12345678910111213141516171819202122232425262728293031323334353637383940414243444546474849505152535455565758596061626364656667686970
三、k-means聚类分析
1.鸢尾花数据集
import matplotlib.pyplot as plt import numpy as np from sklearn.cluster import KMeans from sklearn import datasets from sklearn.datasets import load_iris iris = load_iris() X = iris.data[:] ##表示我们只取特征空间中的后两个维度 estimator = KMeans(n_clusters=5)#构造聚类器 estimator.fit(X)#聚类 label_pred = estimator.labels_ #获取聚类标签 #绘制k-means结果 x0 = X[label_pred == 0] x1 = X[label_pred == 1] x2 = X[label_pred == 2] x3 = X[label_pred == 3] plt.scatter(x0[:, 0], x0[:, 1], c = "red", marker='o', label='label0') plt.scatter(x1[:, 0], x1[:, 1], c = "green", marker='*', label='label1') #plt.scatter(x2[:, 0], x2[:, 1], c = "blue", marker='+', label='label2') #plt.scatter(x3[:, 0], x3[:, 1], c = "yellow", marker='o', label='label3') plt.xlabel('petal length') plt.ylabel('petal width') plt.legend(loc=2) plt.show()
1234567891011121314151617181920212223
2.月亮数据集
import matplotlib.pyplot as plt import numpy as np from sklearn.cluster import KMeans from sklearn.datasets import make_moons X, y = make_moons(n_samples=100, noise=0.15, random_state=42) estimator = KMeans(n_clusters=5)#构造聚类器 estimator.fit(X)#聚类 label_pred = estimator.labels_ #获取聚类标签 #绘制k-means结果 x0 = X[label_pred == 0] x1 = X[label_pred == 1] x2 = X[label_pred == 2] x3 = X[label_pred == 3] plt.scatter(x0[:, 0], x0[:, 1], c = "red", marker='o', label='label0') plt.scatter(x1[:, 0], x1[:, 1], c = "green", marker='*', label='label1') #plt.scatter(x2[:, 0], x2[:, 1], c = "blue", marker='+', label='label2') #plt.scatter(x3[:, 0], x3[:, 1], c = "yellow", marker='o', label='label3') plt.xlabel('petal length') plt.ylabel('petal width') plt.legend(loc=2) plt.show()
123456789101112131415161718192021
四、SVM(支持向量机)算法
1.鸢尾花数据集
import numpy as np import matplotlib.pyplot as plt from sklearn import datasets, svm import pandas as pd from pylab import * mpl.rcParams['font.sans-serif'] = ['SimHei'] 123456
iris = datasets.load_iris() iris = datasets.load_iris() X = iris.data y = iris.target X = X[y != 0, :2] # 选择X的前两个特性 y = y[y != 0] n_sample = len(X) np.random.seed(0) order = np.random.permutation(n_sample) # 排列,置换 X = X[order] y = y[order].astype(np.float) X_train = X[:int(.9 * n_sample)] y_train = y[:int(.9 * n_sample)] X_test = X[int(.9 * n_sample):] y_test = y[int(.9 * n_sample):] 123456789101112131415
#合适的模型 for fig_num, kernel in enumerate(('linear', 'rbf','poly')): # 径向基函数 (Radial Basis Function 简称 RBF),常用的是高斯基函数 clf = svm.SVC(kernel=kernel, gamma=10) # gamma是“rbf”、“poly”和“sigmoid”的核系数。 clf.fit(X_train, y_train) plt.figure(str(kernel)) plt.xlabel('x1') plt.ylabel('x2') plt.scatter(X[:, 0], X[:, 1], c=y, zorder=10, cmap=plt.cm.Paired, edgecolor='k', s=20) # zorder: z方向上排列顺序,数值越大,在上方显示 # paired两个色彩相近输出(paired) # 圈出测试数据 plt.scatter(X_test[:, 0], X_test[:, 1], s=80, facecolors='none',zorder=10, edgecolor='k') plt.axis('tight') #更改 x 和 y 轴限制,以便显示所有数据 x_min = X[:, 0].min() x_max = X[:, 0].max() y_min = X[:, 1].min() y_max = X[:, 1].max() XX, YY = np.mgrid[x_min:x_max:200j, y_min:y_max:200j] Z = clf.decision_function(np.c_[XX.ravel(), YY.ravel()]) # 样本X到分离超平面的距离 Z = Z.reshape(XX.shape) plt.contourf(XX,YY,Z>0,cmap=plt.cm.Paired) plt.contour(XX, YY, Z, colors=['r', 'k', 'b'], linestyles=['--', '-', '--'], levels=[-0.5, 0, 0.5]) # 范围 plt.title(kernel) plt.show()
12345678910111213141516171819202122232425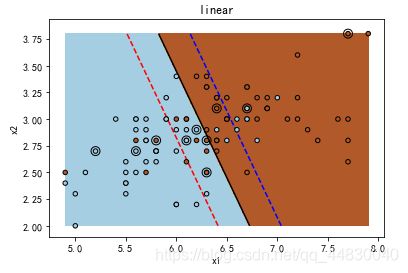


2.月亮数据集
import matplotlib.pyplot as plt from sklearn.pipeline import Pipeline import numpy as np import matplotlib as mpl from sklearn.datasets import make_moons from sklearn.preprocessing import PolynomialFeatures from sklearn.preprocessing import StandardScaler from sklearn.svm import LinearSVC # 为了显示中文 mpl.rcParams['font.sans-serif'] = [u'SimHei'] mpl.rcParams['axes.unicode_minus'] = False X, y = make_moons(n_samples=100, noise=0.15, random_state=42) def plot_dataset(X, y, axes): plt.plot(X[:, 0][y==0], X[:, 1][y==0], "bs") plt.plot(X[:, 0][y==1], X[:, 1][y==1], "g^") plt.axis(axes) plt.grid(True, which='both') plt.xlabel(r"$x_1$", fontsize=20) plt.ylabel(r"$x_2$", fontsize=20, rotation=0) plt.title("月亮数据",fontsize=20) plot_dataset(X, y, [-1.5, 2.5, -1, 1.5]) plt.show()
12345678910111213141516171819202122
polynomial_svm_clf = Pipeline([ # 将源数据 映射到 3阶多项式 ("poly_features", PolynomialFeatures(degree=3)), # 标准化 ("scaler", StandardScaler()), # SVC线性分类器 ("svm_clf", LinearSVC(C=10, loss="hinge", random_state=42)) ]) polynomial_svm_clf.fit(X, y) def plot_predictions(clf, axes): # 打表 x0s = np.linspace(axes[0], axes[1], 100) x1s = np.linspace(axes[2], axes[3], 100) x0, x1 = np.meshgrid(x0s, x1s) X = np.c_[x0.ravel(), x1.ravel()] y_pred = clf.predict(X).reshape(x0.shape) y_decision = clf.decision_function(X).reshape(x0.shape) # print(y_pred) # print(y_decision) plt.contourf(x0, x1, y_pred, cmap=plt.cm.brg, alpha=0.2) plt.contourf(x0, x1, y_decision, cmap=plt.cm.brg, alpha=0.1) plot_predictions(polynomial_svm_clf, [-1.5, 2.5, -1, 1.5]) plot_dataset(X, y, [-1.5, 2.5, -1, 1.5]) plt.show()
123456789101112131415161718192021222324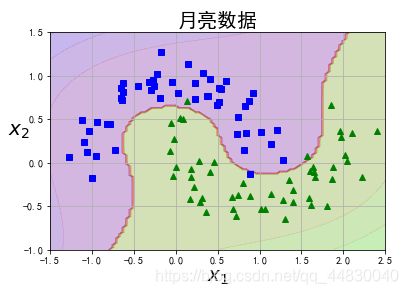
from sklearn.svm import SVC gamma1, gamma2 = 0.1, 5 C1, C2 = 0.001, 1000 hyperparams = (gamma1, C1), (gamma1, C2) svm_clfs = [] for gamma, C in hyperparams: rbf_kernel_svm_clf = Pipeline([ ("scaler", StandardScaler()), ("svm_clf", SVC(kernel="rbf", gamma=gamma, C=C)) ]) rbf_kernel_svm_clf.fit(X, y) svm_clfs.append(rbf_kernel_svm_clf) plt.figure(figsize=(11, 7)) for i, svm_clf in enumerate(svm_clfs): plt.subplot(221 + i) plot_predictions(svm_clf, [-1.5, 2.5, -1, 1.5]) plot_dataset(X, y, [-1.5, 2.5, -1, 1.5]) gamma, C = hyperparams[i] plt.title(r"$gamma = {}, C = {}$".format(gamma, C), fontsize=16) plt.tight_layout() plt.show()
123456789101112131415161718192021
五、SVM算法的优缺点
优点①SVM算法既可以解决线性问题,又可以解决非线性问题②非线性映射是SVM方法的理论基础,SVM利用内积核函数代替向高维空间的非线性映射③对特征空间划分的最优超平面是SVM的目标,最大化分类边际的思想是SVM方法的核心④支持向量是SVM的训练结果,在SVM分类决策中起决定作用的是支持向量优点①对参数调节和核函数的选择敏感②不易处理多分类问题③对大规模训练样本难以实施④SVM的可解释性较差,无法给出决策树那样的规则 参考文献周志华《机器学习》LDA深入补充推导和python实现(二分类问题)
相关知识
鸢尾花数据集下载
分析鸢尾花数据集
实验一:鸢尾花数据集分类
【机器学习】经典数据集鸢尾花的分类识别
人工智能考试——k近邻算法对鸢尾花(iris)数据集进行分析
python鸢尾花数据集的分类问题 -- 逻辑回归问题研究
K近邻算法和鸢尾花问题
【机器学习实战】科学处理鸢尾花数据集
Tensorflow训练鸢尾花数据集
python实践gcForest模型对鸢尾花数据集iris进行分类
原文链接: 对鸢尾花数据集和月亮数据集,分别采用线性LDA、k https://m.huajiangbk.com/newsview387281.html
| 上一篇: 用python实现KNN算法对鸢... | 下一篇: 1991年·伍 |


