鸢尾花分类与直方图、散点图的绘制及可视化决策树
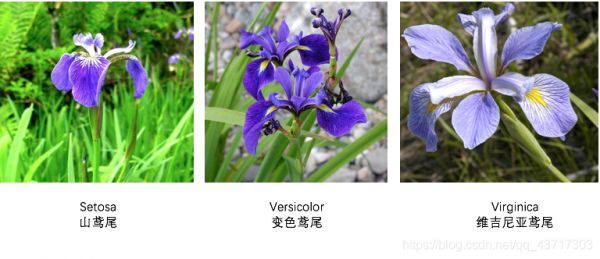 二、IRIS数据集 列名说明类型SepalLength花萼长度floatSepalWidth花萼宽度floatPetalLength花瓣长度floatPetalWidth花瓣宽度floatClass类别变量。0表示山鸢尾,1表示变色鸢尾,2表示维吉尼亚鸢尾int 三、实验环境
Jupyter-notebook、Scikit-learn
四、实验内容 绘制各维度直方图绘制各维度散点图矩阵训练决策树模型(尝试不同决策树参数对分类准确度的影响)可视化决策树 五、实验代码和结果截图 1、导入Python包import graphviz import numpy as np import pandas as pd import matplotlib.pyplot as plt from sklearn import tree from sklearn.datasets import load_iris from sklearn.tree import export_graphviz from sklearn.model_selection import train_test_split 123456782、全局变量
iris = load_iris()# 载入鸢尾花数据集 1
datas = iris.data# (150,4):150 行 5 列 # print(datas) # print(iris.target) 123
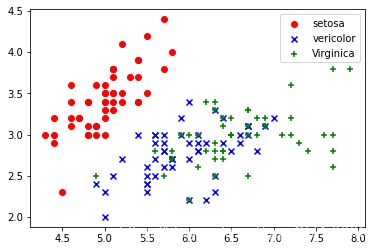
x1 = [x[0] for x in datas]# 第1列:花萼长度 sepal_length x2 = [x[1] for x in datas]# 第2列:花萼宽度 sepal_width x3 = [x[2] for x in datas]# 第3列:花瓣长度 petal_length x4 = [x[3] for x in datas]# 第4列:花瓣宽度 petal_width 12343、均分样本的散点图,仅花萼长度和花萼宽度
plt.scatter(x1[:50], x2[:50], color='red', marker='o', label='setosa') # 前50个样本 plt.scatter(x1[50:100],x2[50:100],color='blue',marker='x',label='vericolor')# 中间50个样本 plt.scatter(x1[100:150],x2[100:150],color='green',marker='+',label='Virginica')# 后50个样本 plt.legend(loc=1)# loc=1,2,3,4分别表示label在右上角,左上角,左下角,右下角 plt.show() 12345
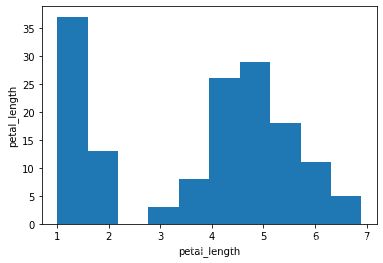
# 单个直方图 # sepal_length 直方图 plt.hist(x1) plt.xlabel("sepal_length") plt.ylabel("sepal_length") plt.show() # sepal_width 直方图 plt.hist(x2) plt.xlabel("sepal_width") plt.ylabel("sepal_width") plt.show() # petal_length 直方图 plt.hist(x3) plt.xlabel("petal_length") plt.ylabel("petal_length") plt.show() # petal_width 直方图 plt.hist(x4) plt.xlabel("petal_width") plt.ylabel("petal_width") plt.show()
123456789101112131415161718192021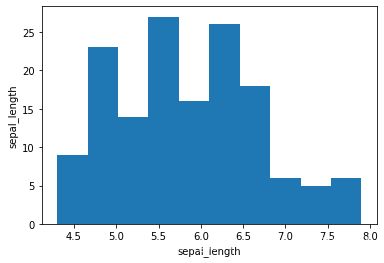

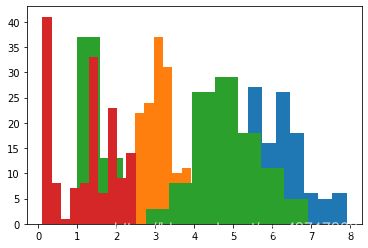
 5、各维度直方图合为一图
# 四合一 plt.hist(x1) plt.hist(x2) plt.hist(x3) plt.hist(x4) plt.show() 123456
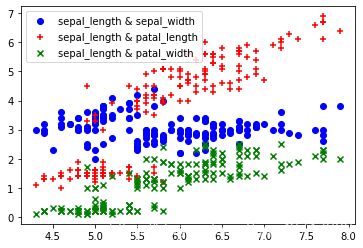
# 单个散点图(其他的同理) plt.scatter(x1,x2,color='blue',marker='o',label='sepal_length & sepal_width') plt.scatter(x1,x3,color='red',marker='+',label='sepal_length & petal_length') plt.scatter(x1,x4,color='green',marker='x',label='sepal_length & petal_width') plt.legend(loc=2) plt.show() 123456
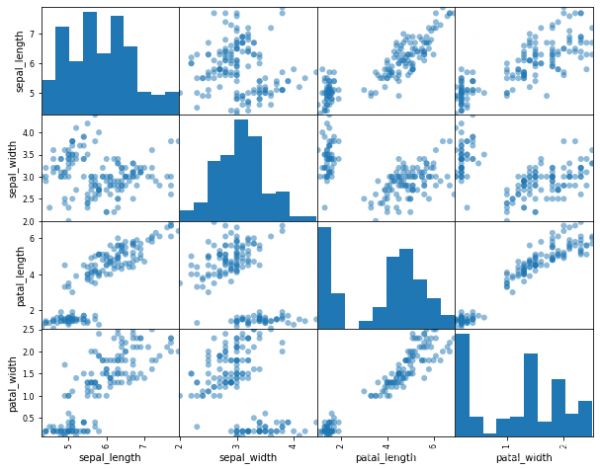
# 直方图、散点图 irisdf = pd.DataFrame(datas,columns=['sepal_length','sepal_width','petal_length','petal_width']) pd.plotting.scatter_matrix(irisdf,alpha = 0.5, figsize =(10,8) ,grid = False, diagonal = 'hist',marker = 'o', range_padding = 0.01) plt.show() 1234567
x_true = iris.data y_true = iris.target # 一般划分比例:测试集约为1/3 x_train,x_test,y_train,y_test = train_test_split(x_true,y_true,test_size=0.33) # 查看训练集样本、训练集样本标签、测试集样本、测试集样本标签的 大小 # print("训练集样本大小:",x_train.shape) # print("训练集样本标签大小",y_train.shape) # print("测试集样本大小:",x_test.shape) # print("测试集样本大小:",y_test.shape) # 决策树模型参数:criterion、splitter、max_depth、min_impurity_decrease、min_samples_split、 # min_samples_leaf、max_leaf_nodes、min_impurity_split、min_weight_fraction_leaf、class_weight clf = tree.DecisionTreeClassifier(criterion="entropy")# 构造决策树 clf.fit(x_train,y_train)# 训练模型 # # 计算准确率 # y_predict = clf.predict(x_test) # print(y_predict) # accuracy = sum(y_predict == y_test)/y_test.shape[0] # print('The accuracy is',accuracy) score = clf.score(x_test,y_test)# 评价模型 print("nThe accuracy is",score)
12345678910111213141516171819202122232425
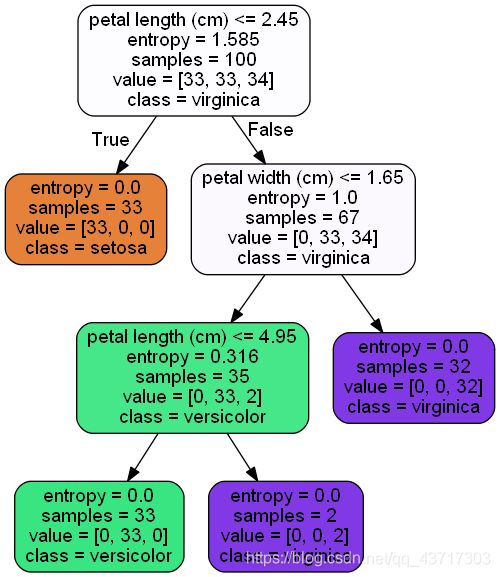
# 可视化决策树 feature_names = iris.feature_names target_names = iris.target_names clf_dot = tree.export_graphviz(clf,out_file = None, feature_names = feature_names, class_names = target_names, filled = True,rounded = True) graph = graphviz.Source(clf_dot, filename= "iris_decisionTree.gv",format= "png") graph.view() 1234567891011
# 显示特征重要程度 print("特征重要程度为:") info = [*zip(feature_names, clf.feature_importances_)] for cell in info: print(cell) 12345

#!/usr/bin/env python # coding: utf-8 # In[104]: import graphviz import numpy as np import pandas as pd import matplotlib.pyplot as plt from sklearn import tree from sklearn.datasets import load_iris from sklearn.tree import export_graphviz from sklearn.model_selection import train_test_split # In[105]: iris = load_iris()# 载入鸢尾花数据集 # In[106]: datas = iris.data# (150,4):150行5列 # print(datas) # print(iris.target) # In[107]: x1 = [x[0] for x in datas]# 第1列:花萼长度 sepal_length x2 = [x[1] for x in datas]# 第2列:花萼宽度 sepal_width x3 = [x[2] for x in datas]# 第3列:花瓣长度 petal_length x4 = [x[3] for x in datas]# 第4列:花瓣宽度 petal_width # In[72]: plt.scatter(x1[:50], x2[:50], color='red', marker='o', label='setosa') # 前50个样本 plt.scatter(x1[50:100],x2[50:100],color='blue',marker='x',label='vericolor')# 中间50个样本 plt.scatter(x1[100:150],x2[100:150],color='green',marker='+',label='Virginica')# 后50个样本 plt.legend(loc=1)# loc=1,2,3,4分别表示label在右上角,左上角,左下角,右下角 plt.show() # In[108]: # 单个直方图 # sepal_length 直方图 plt.hist(x1) plt.xlabel("sepal_length") plt.ylabel("sepal_length") plt.show() # sepal_width 直方图 plt.hist(x2) plt.xlabel("sepal_width") plt.ylabel("sepal_width") plt.show() # petal_length 直方图 plt.hist(x3) plt.xlabel("petal_length") plt.ylabel("petal_length") plt.show() # petal_width 直方图 plt.hist(x4) plt.xlabel("petal_width") plt.ylabel("petal_width") plt.show() # In[47]: # 四合一 plt.hist(x1) plt.hist(x2) plt.hist(x3) plt.hist(x4) plt.show() # In[76]: # 单个散点图(其他的同理) plt.scatter(x1,x2,color='blue',marker='o',label='sepal_length & sepal_width') plt.scatter(x1,x3,color='red',marker='+',label='sepal_length & petal_length') plt.scatter(x1,x4,color='green',marker='x',label='sepal_length & petal_width') plt.legend(loc=2) plt.show() # In[77]: # 直方图、散点图 irisdf = pd.DataFrame(datas,columns=['sepal_length','sepal_width','petal_length','petal_width']) pd.plotting.scatter_matrix(irisdf,alpha = 0.5, figsize =(10,8) ,grid = False, diagonal = 'hist',marker = 'o', range_padding = 0.01) plt.show() # In[122]: x_true = iris.data y_true = iris.target # 一般划分比例:测试集约为1/3 x_train,x_test,y_train,y_test = train_test_split(x_true,y_true,test_size=0.33) # 查看训练集样本、训练集样本标签、测试集样本、测试集样本标签的 大小 # print("训练集样本大小:",x_train.shape) # print("训练集样本标签大小",y_train.shape) # print("测试集样本大小:",x_test.shape) # print("测试集样本大小:",y_test.shape) # 决策树模型参数:criterion、splitter、max_depth、min_impurity_decrease、min_samples_split、 # min_samples_leaf、max_leaf_nodes、min_impurity_split、min_weight_fraction_leaf、class_weight clf = tree.DecisionTreeClassifier(criterion="entropy")# 构造决策树 clf.fit(x_train,y_train)# 训练模型 # # 计算准确率 # y_predict = clf.predict(x_test) # print(y_predict) # accuracy = sum(y_predict == y_test)/y_test.shape[0] # print('The accuracy is',accuracy) score = clf.score(x_test,y_test)# 评价模型 print("nThe accuracy is",score) # In[126]: # 可视化决策树 feature_names = iris.feature_names target_names = iris.target_names clf_dot = tree.export_graphviz(clf,out_file = None, feature_names = feature_names, class_names = target_names, filled = True,rounded = True) graph = graphviz.Source(clf_dot, filename= "iris_decisionTree.gv",format= "png") graph.view() # In[127]: # 显示特征重要程度 print("特征重要程度为:") info = [*zip(feature_names, clf.feature_importances_)] for cell in info: print(cell)
123456789101112131415161718192021222324252627282930313233343536373839404142434445464748495051525354555657585960616263646566676869707172737475767778798081828384858687888990919293949596979899100101102103104105106107108109110111112113114115116117118119120121122123124125126127128129130131132133134135136137138139140141142143144145146147148149150151152153154155156157158159160161162163相关知识
使用pandas绘制两列csv的直方图
机器学习案例:鸢尾花分类——基于Scikit
【机器学习】鸢尾花分类
基于决策树构建鸢尾花数据的分类模型并绘制决策树模型
[机器学习基础][笔记] 一、鸢尾花分类
机器学习(三):感知器算法实现鸢尾花分类项目实战
Python中的数据可视化:Matplotlib基础与高级技巧
3.4 数据可视化
python利用c4.5决策树对鸢尾花卉数据集进行分类(iris)
用R 语言,进行静态绘图和 Shiny 的交互可视化演示
原文链接: 鸢尾花分类与直方图、散点图的绘制及可视化决策树 https://m.huajiangbk.com/newsview387304.html
| 上一篇: 5 MLP版本的鸢尾花分类任务 | 下一篇: 作业5:SVM实现鸢尾花分类 |


