Matplotlib基础04:使用Pandas绘制鸢尾花数据集
Matplotlib基础04:使用Pandas绘制鸢尾花数据集
pandas模块简介
Pandas模块是Python用于数据导入及整理的模块,对数据挖掘前期数据的处理工作十分有用。Pandas模块的数据结构主要有两:1、Series ;2、DataFrame相比较于Numpy,Pandas可以存储混合的数据结构,同时使用NaN来表示缺失的数据,而不用像Numpy一样要手工处理缺失的数据,并且Pandas使用轴标签来表示行和列。DataFrame:一个表格型的数据结构,包含有一组有序的列,每列可以是不同的值类型(数值、字符串、布尔型等),DataFrame即有行索引也有列索引,可以被看做是由Series组成的字典。DataFrame有四个重要的属性:index:行索引。
columns:列索引。
values:值的二维数组。
name:名字。Series结构是基于NumPy的ndarray结构,是一个一维的标签矩阵(感觉跟python里的字典结构有点像)
1. Series模块:
import pandas as pd import numpy as np print("######################创建一个series##########################################") #1.参数是list,index可以不指定,默认0,1,2 series = pd.Series([1,2,3,4],index=['a','b','c','d']) print(series) #2.参数是字典 dict = {'a':1,'b':2,"c":3,'d':4} series = pd.Series(dict) print(series) print("################类似于np数组,可以进行切片,取值,加减法等##############################") v = np.random.uniform(0,1,size=50) series = pd.Series(v) #打印指定索引的数字,同时可以输出索引的 print(series[[3,34,25]]) #只输出对应的数,不用输出索引 print(series[3],series[34],series[25]) #切片形式,会输出索引 print(series[1:6],"切片形式,会输出索引") #加减乘法,是相同的索引就进行运算,索引非两者共有,则为NaN s1 = pd.Series([1,2,3,4],index=[1,2,3,4]) s2 = pd.Series([0,0,0,0],index=[2,3,4,5]) print(s1+s2,"加减乘法,是相同的索引就进行运算,索引非两者共有,则为NaN") #取索引或者list print(series.index) print(series.values) print("############################header与tail###############################################") #s.head(n);.tail(n)//取出头n行或尾n行,n为可选参数,若不填默认5 s = pd.Series(v) print(s.head()) print(s.tail(3)) print("------------------Series的属性-------------------") print("len():",len(s))#Series长度,包括NaN print ("shape():",np.shape(s))#矩阵形状,(,) print ("count():",s.count())#Series长度,不包括NaN print("unique():",s.unique()) #出现不重复values值 print ("value_counts():n",s.value_counts())#统计每个value值出现次数
123456789101112131415161718192021222324252627282930313233343536373839404142'运行结果
PS E:Anaconda-Vs-code> & C:/Users/86158/Anaconda3/envs/tensorflow/python.exe e:/Anaconda-Vs-code/第六讲Matplotlib/matplotlib基础03pandas.py/panda基本语法.py ######################创建一个series########################################## a 1 b 2 c 3 d 4 dtype: int64 a 1 b 2 c 3 d 4 dtype: int64 ################类似于np数组,可以进行切片,取值,加减法等############################## 3 0.415582 34 0.458589 25 0.975200 dtype: float64 0.41558192801102845 0.4585887695625541 0.9751998285422367 1 0.836265 2 0.675382 3 0.415582 4 0.656184 5 0.440431 dtype: float64 切片形式,会输出索引 1 NaN 2 2.0 3 3.0 4 4.0 5 NaN dtype: float64 加减乘法,是相同的索引就进行运算,索引非两者共有,则为NaN RangeIndex(start=0, stop=50, step=1) [0.67765165 0.83626514 0.67538175 0.41558193 0.65618418 0.44043073 0.37757155 0.21390985 0.30330874 0.62883411 0.46198418 0.69404797 0.10995785 0.02885739 0.613955 0.58406923 0.02610615 0.84504904 0.17421594 0.459956 0.66605335 0.09834195 0.10498337 0.67250842 0.21729545 0.97519983 0.68814137 0.16144825 0.56027213 0.57316921 0.41345705 0.0897135 0.6374946 0.04959282 0.45858877 0.01610472 0.58665787 0.50637486 0.31117577 0.59124138 0.38645648 0.33386051 0.1943533 0.85668243 0.41325846 0.33481518 0.11426562 0.55620363 0.71096422 0.52368542] ############################header与tail############################################### 0 0.677652 1 0.836265 2 0.675382 3 0.415582 4 0.656184 dtype: float64 47 0.556204 48 0.710964 49 0.523685 dtype: float64 ------------------Series的属性------------------- len(): 50 shape(): (50,) count(): 50 unique(): [0.67765165 0.83626514 0.67538175 0.41558193 0.65618418 0.44043073 0.37757155 0.21390985 0.30330874 0.62883411 0.46198418 0.69404797 0.10995785 0.02885739 0.613955 0.58406923 0.02610615 0.84504904 0.17421594 0.459956 0.66605335 0.09834195 0.10498337 0.67250842 0.21729545 0.97519983 0.68814137 0.16144825 0.56027213 0.57316921 0.41345705 0.0897135 0.6374946 0.04959282 0.45858877 0.01610472 0.58665787 0.50637486 0.31117577 0.59124138 0.38645648 0.33386051 0.1943533 0.85668243 0.41325846 0.33481518 0.11426562 0.55620363 0.71096422 0.52368542] value_counts(): 0.334815 1 0.311176 1 0.677652 1 0.666053 1 0.856682 1 0.413258 1 0.333861 1 0.104983 1 0.213910 1 0.584069 1 0.556204 1 0.161448 1 0.303309 1 0.523685 1 0.688141 1 0.586658 1 0.377572 1 0.694048 1 0.675382 1 0.459956 1 0.710964 1 0.026106 1 0.461984 1 0.415582 1 0.413457 1 0.089713 1 0.028857 1 0.194353 1 0.098342 1 0.591241 1 0.217295 1 0.386456 1 0.458589 1 0.845049 1 0.836265 1 0.109958 1 0.672508 1 0.613955 1 0.560272 1 0.656184 1 0.573169 1 0.049593 1 0.440431 1 0.628834 1 0.975200 1 0.174216 1 0.506375 1 0.114266 1 0.637495 1 0.016105 1 dtype: int64
1234567891011121314151617181920212223242526272829303132333435363738394041424344454647484950515253545556575859606162636465666768697071727374757677787980818283848586878889909192939495969798991001011021031041051061071081091101111121131141151162. DataFrame模块:
DataFrame创建的两种方式:
1. 通过二维数组创建
2. 通过字典的方式创建,此种方法创建同时还要注意:
字典中的value值只能是一维数组 或 单个的简单数据类型,
如果是数组,要求所有数组长度一致,如果是单个数据,则会使每行添加相同数据。
创建
#方法1:二维数组 df1 = pd.DataFrame([['joe','jone','Amy'], [21,22,23],['teacher','doctor','programmer']]) print(df1) #方法2:使用字典,设置索引index,字典里的key会变成列索引标签,行索引是字典里面value df2 = pd.DataFrame({'name':['joe','jone','Amy'], 'sex':['men','men','gril'], 'job':['teacher','doctor','programmer'], 'age':[21,22,23]}, index = ['first','second','third']) print(df2) 1234567891011

使用其索引对象
不管是Series还是DataFrame对象,都有索引对象。索引对象负责管理轴标签和其它元数据(axes)通过索引可以从Series、DataFrame中获取值或者对某个索引值进行重新赋值。Series或者DataFrame的自动对齐功能是通过索引实现的
如:
修改列
print(df2.values,"发现打印出来了value") #打印行列数据 print(df2.index,"n",df2.columns,"发现打印出来了行列的值") #修改列,存在这样的列就输出,不存在就创建 print(df2['name'],'发现打印出name这一列的数据n',df2['sex'],"发现打印出sex这一列数据") df2['kind_not'] = ['no','yes','no'] print(df2) #删除使用pop df2.pop("age") print(df2) 12345678910

修改行
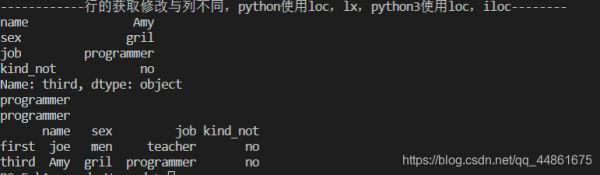
print("------------行的获取修改与列不同,python使用loc,lx,python3使用loc,iloc--------") #打印第二行 print(df2.iloc[2]) #使用loc获取指定行列的值 print(df2.loc['third','job']) #也可以使用df2.loc['third']['job'] print(df2.loc['third']['job']) #删除使用drop,如删除第一行 df2 = df2.drop('second') print(df2) 12345678910
使用pandas与matplotlib绘制数据集
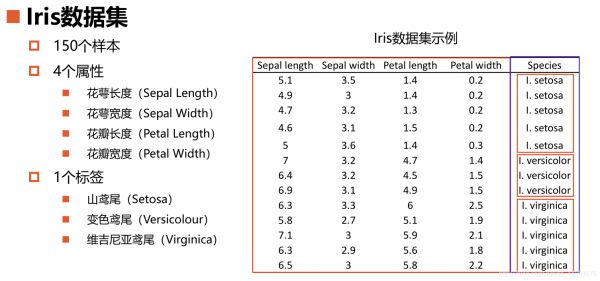
1 .关于鸢尾花数据集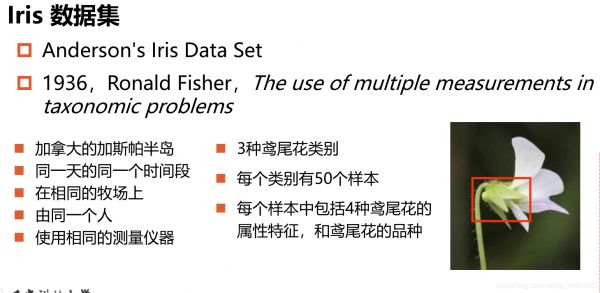
数据集的下载
get_file()函数——下载数据集
tf.keras.utils.get_file(fname, origin, cache_dir) """ fname:下载后的文件名; origin:文件的URL地址; cache_dir:下载后文件的存储位置。C:UsersAdministrator.kerasdatasets n 参数 n 返回值:下载后的文件在本地磁盘中的绝对路径。 """ 12345678
若没有该数据集会下载:
和我们了解的csv数据集一样,打开,里面是一堆数据
import pandas as pd import numpy as np import matplotlib import tensorflow as tf import matplotlib.pyplot as plt TRAIN_URL = 'http://download.tensorflow.org/data/iris_training.csv' #下载数据集 train_path = tf.keras.utils.get_file(TRAIN_URL.split('/')[-1],TRAIN_URL) #设置观察数据 COLUMN_NAMES = ['SepalLength','SepalWidth','PetalLength','Species'] #读取数据集第一列作为标签 df_iris = pd.read_csv(train_path,names=COLUMN_NAMES,header=0) #转化为numpy数组 iris = np.array(df_iris) fig = plt.figure('iris data',figsize=(15,15)) fig.suptitle("Anderson's iris data setn(Blue->Setosa | Red->Versioncolor | Green->Virginica)",fontsize=20) for i in range(4): for j in range(4): plt.subplot(4,4,4*i+(j+1)) if i==j: plt.text(0.3,0.4,COLUMN_NAMES[i],fontsize=15) else: plt.scatter(iris[:,j],iris[:,i],c=iris[:,3],cmap='brg') if i==0: plt.title(COLUMN_NAMES[j]) if j==0: plt.ylabel(COLUMN_NAMES[i]) plt.tight_layout() plt.show()
12345678910111213141516171819202122232425262728293031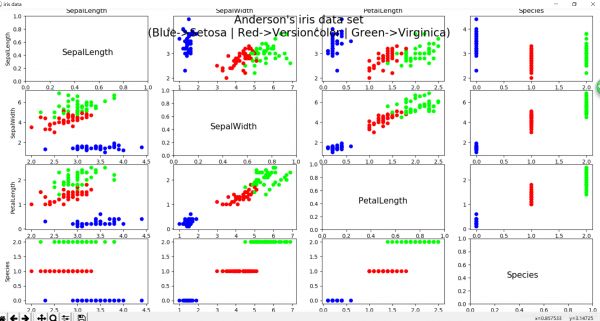
相关知识
使用pandas绘制两列csv的直方图
python 鸢尾花数据集下载
鸢尾花(Iris)数据集入门
鸢尾花数据可视化——基于matplotlib
[机器学习基础][笔记] 一、鸢尾花分类
鸢尾花数据集的数据可视化
机器学习鸢尾花数据集
数据可视化——鸢尾花数据集的分析与散点图的绘制
基于鸢尾花数据集实施自组织神经网络聚类分析
鸢尾花数据集分析
原文链接: Matplotlib基础04:使用Pandas绘制鸢尾花数据集 https://m.huajiangbk.com/newsview643355.html
| 上一篇: 机器学习入门实践——鸢尾花分类 | 下一篇: 全方位精美礼品包装技巧指南大全 |


